October 2022
Integrating information on a range of relevant and interconnected dimensions depicting the complexity of our society and culture can be challenging. Traditional composite indicators, visualized sequentially, do not enable users to intuitively extract the essential and interconnected patterns from the data. Can modern visualization approaches better integrate the multidimensional nature of complex social phenomena by revealing essential key findings to the user? In other words, can advanced data visualization let the data, in all its complexity, speak for itself?
These were some of the themes and questions posed by the 26th International Conference on Science, Technology, and Innovation Indicators (STI 2022) in Grenada, Spain, September 7-9, 2022.
Held in person for the first time since the pandemic, the conference brought together more than 250 scientists and bibliometricians, including Science-Metrix’s David Campbell and Alexandre Bédard-Vallée, who presented a paper based on their research into gender differences in interdisciplinary publications and self-citation patterns.
For both, a highlight of the programme was a plenary by digital culture theorist Lev Manovich. Manovich spoke about the possibilities of using data analytics to visualize large, highly varied data sets drawn from contemporary life and culture.
For example, Manovich’s project Selfie City examines selfies taken in five cities around the world. A dynamic tool allows users to manipulate visualizations to compare the gender and age range of the selfie-takers, along with their poses and expressions. Users can examine differences between cities, as well as the library of images. “Using the tool, users are free to self-select features of the data they wish to explore in more depth, not only revealing the summary statistics but also their underlying distributions. That’s much richer than providing a static set of summary statistics and places the users at the center, and in full control, of the analysis,” Mr. Bédard-Vallée said.
An overarching theme within the conference, surfacing in multiple talks, was the idea of “data humanism,” an approach that moves beyond mere numbers in tables to more effectively tell a story from a mix of information sources. This offers users something less definitive than a set of numbers, yet richer and more useful.
For example, Stefanie Haustein presented on rethinking a dashboard design process for open science and biomedical science. “Instead of the traditional approach to building dashboards … ‘that’s the data I have, that’s the data I’m going to present,’” Mr. Bédard-Vallée said, she decided to ask people working in the field what they wanted to see and let that drive the design of a more useful, user-centered product.
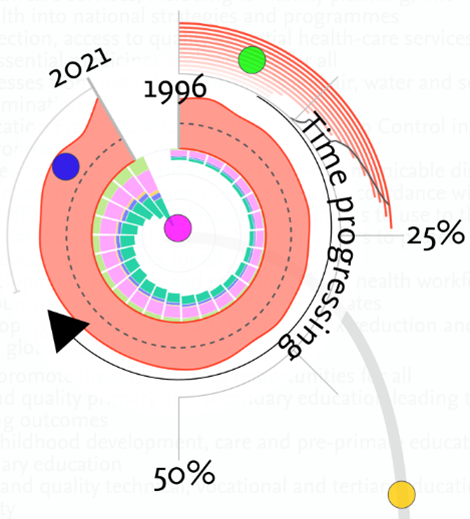
The theme of data humanism later inspired Mr. Bédard-Vallée to experiment with a new approach to creating data visualizations from complex data sets. A preliminary sketch of a concept is pictured. This visualization depicts multiple dimensions measured from scientific literature relevant to one of the UN’s sustainable development goals. The inside bars (l) show the contribution of selected countries and regions to this area of scientific research through time. The shaded area (l) symbolizes the quantity of policy citations received by research papers relevant to this goal from 1996 to 2021; the dark dotted line shows the expectation accounting for the originating scientific discipline and publication year of research articles. The outer arcs (l) symbolize the evolution of international collaboration through time (arcs closer to the center represent earlier years) visualized as the share of papers with authors from at least two countries. Edges (l) connect SDGs in pairs highlighting instances where research articles are relevant to many SDGs at once.
It was fitting that a conference discussing data humanism also offered the chance to meet or reconnect in person with colleagues who had long been only visible on a screen. “Particularly after the last two or three years,” Mr. Bédard-Vallée said, “and what we went through, when we weren’t allowed to see other people or travel…people were just really happy to get back to something more normal and meet each other face to face.”
Image: Adapted from work by Alexandre Bédard-Vallée